Tools Used:
Microsoft Excel, PivotTables, Charts, Conditional Formatting
Project Description:
This dashboard analyzes service data from a fictional car dealership. It provides insights into service trends, technician performance, monthly revenue, and customer satisfaction. The goal was to demonstrate data analysis skills using Excel for business insights.
Key Insights:
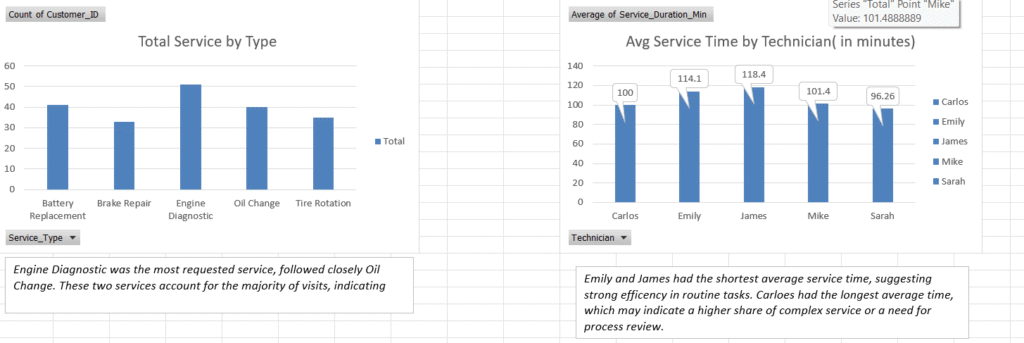
- Most requested services were Oil Changes and Engine Diagnostics
- Emily and James had the fastest average service times
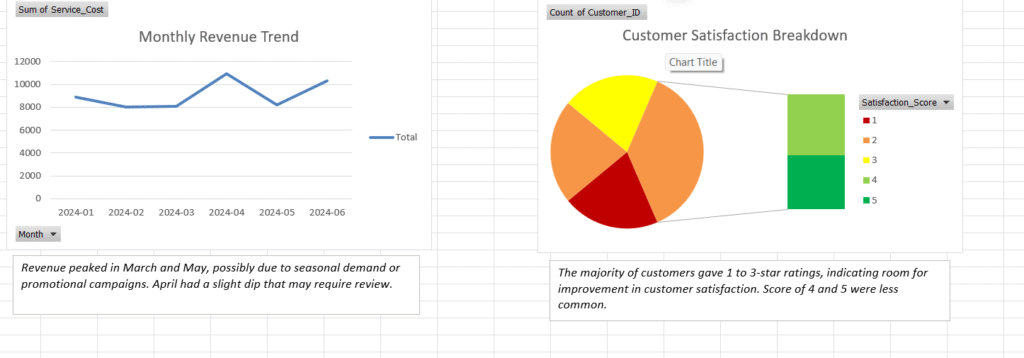
- March and May saw the highest revenue
- Most customer feedback was neutral to negative, revealing areas to improve service experience
Car Dealership Service Dashboard
Skills Demonstrated: Data cleaning, visualization, business analysis
This dashboard analyzes service operations at a fictional car dealership. It covers:
- The most common service types
- Technician performance based on average service times
- Monthly revenue trends
- Customer satisfaction scores


Car Dealership Service Dashboard
Analyzed service records using Excel to uncover trends in average cost, satisfaction scores, and service frequency. Designed a clear, interactive dashboard to visualize insight for business decision-making.
